Study figure and data
Retinol: average fine-wrinkle scores
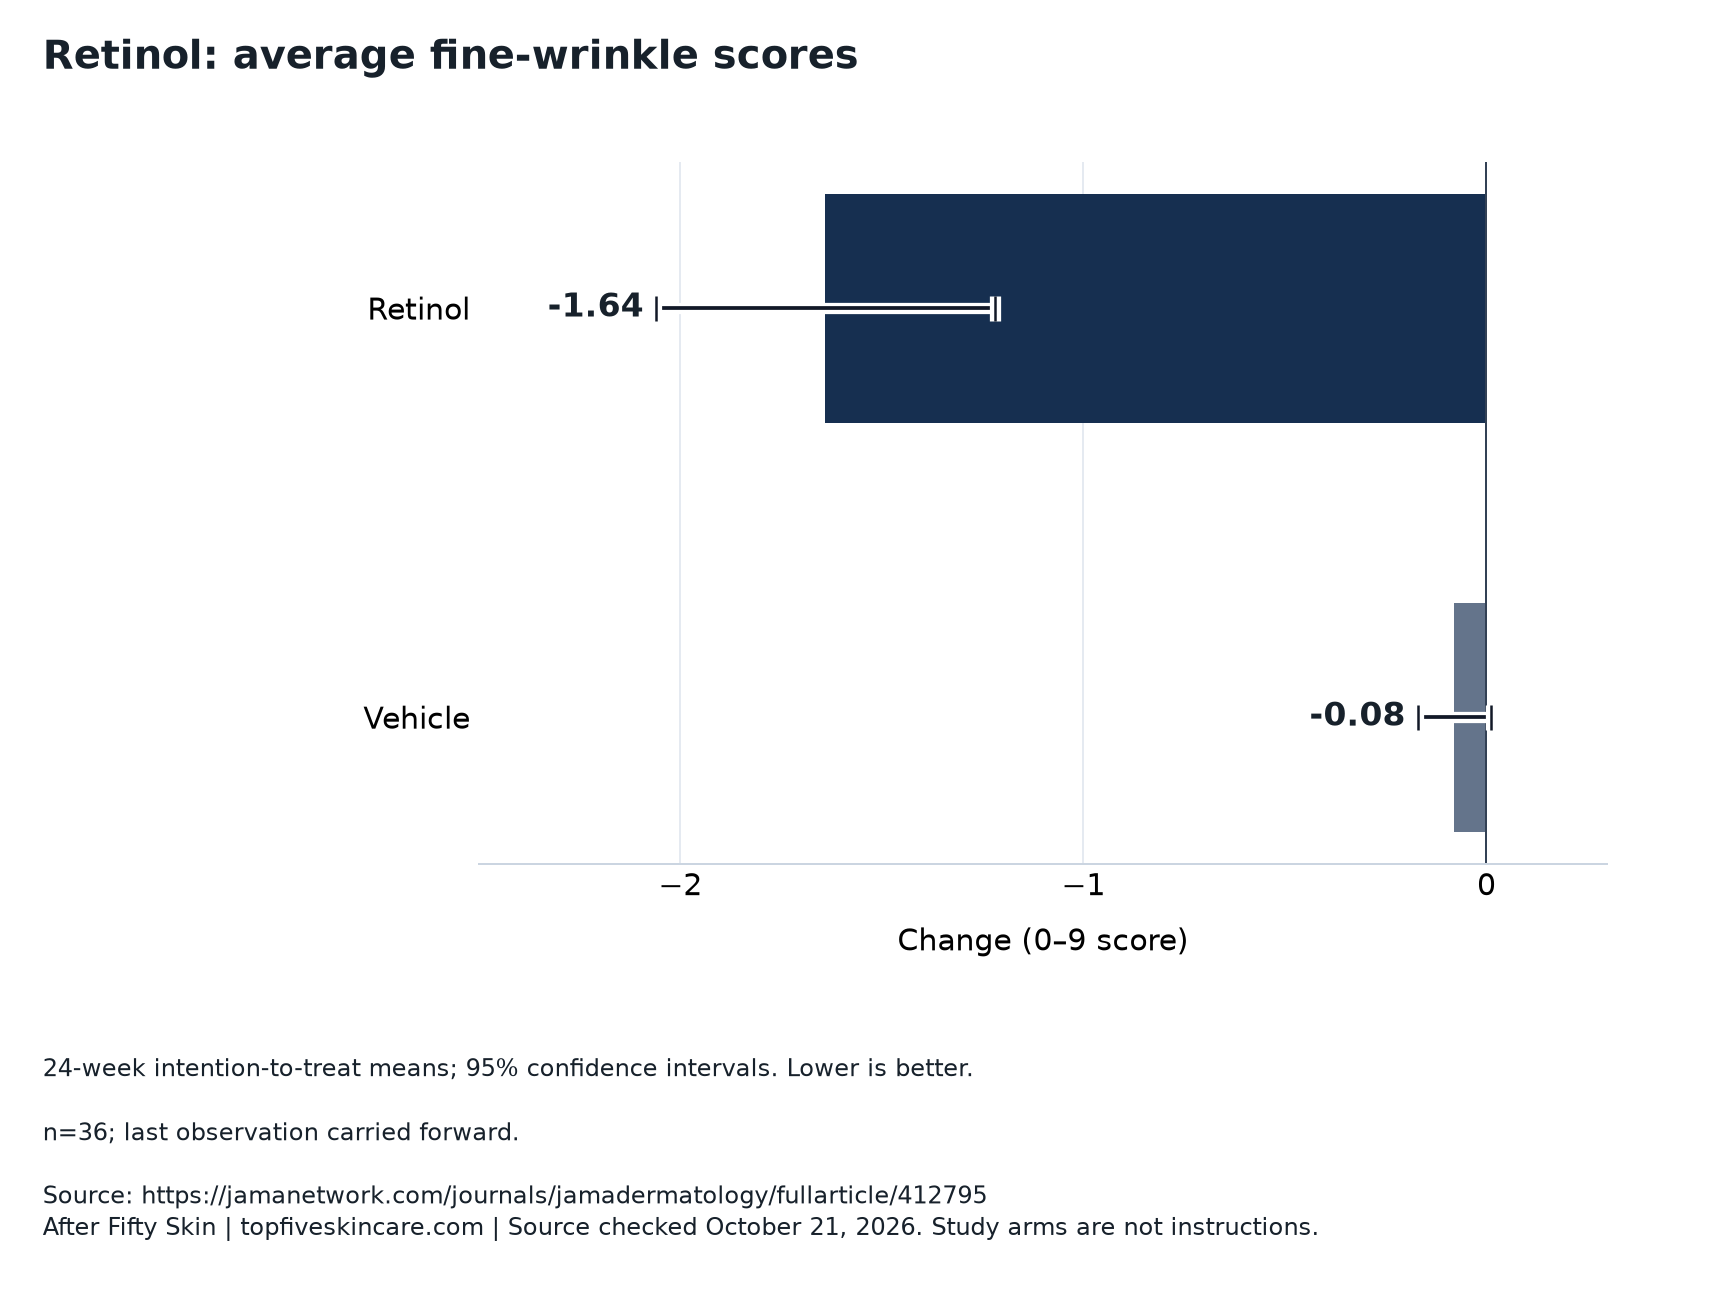
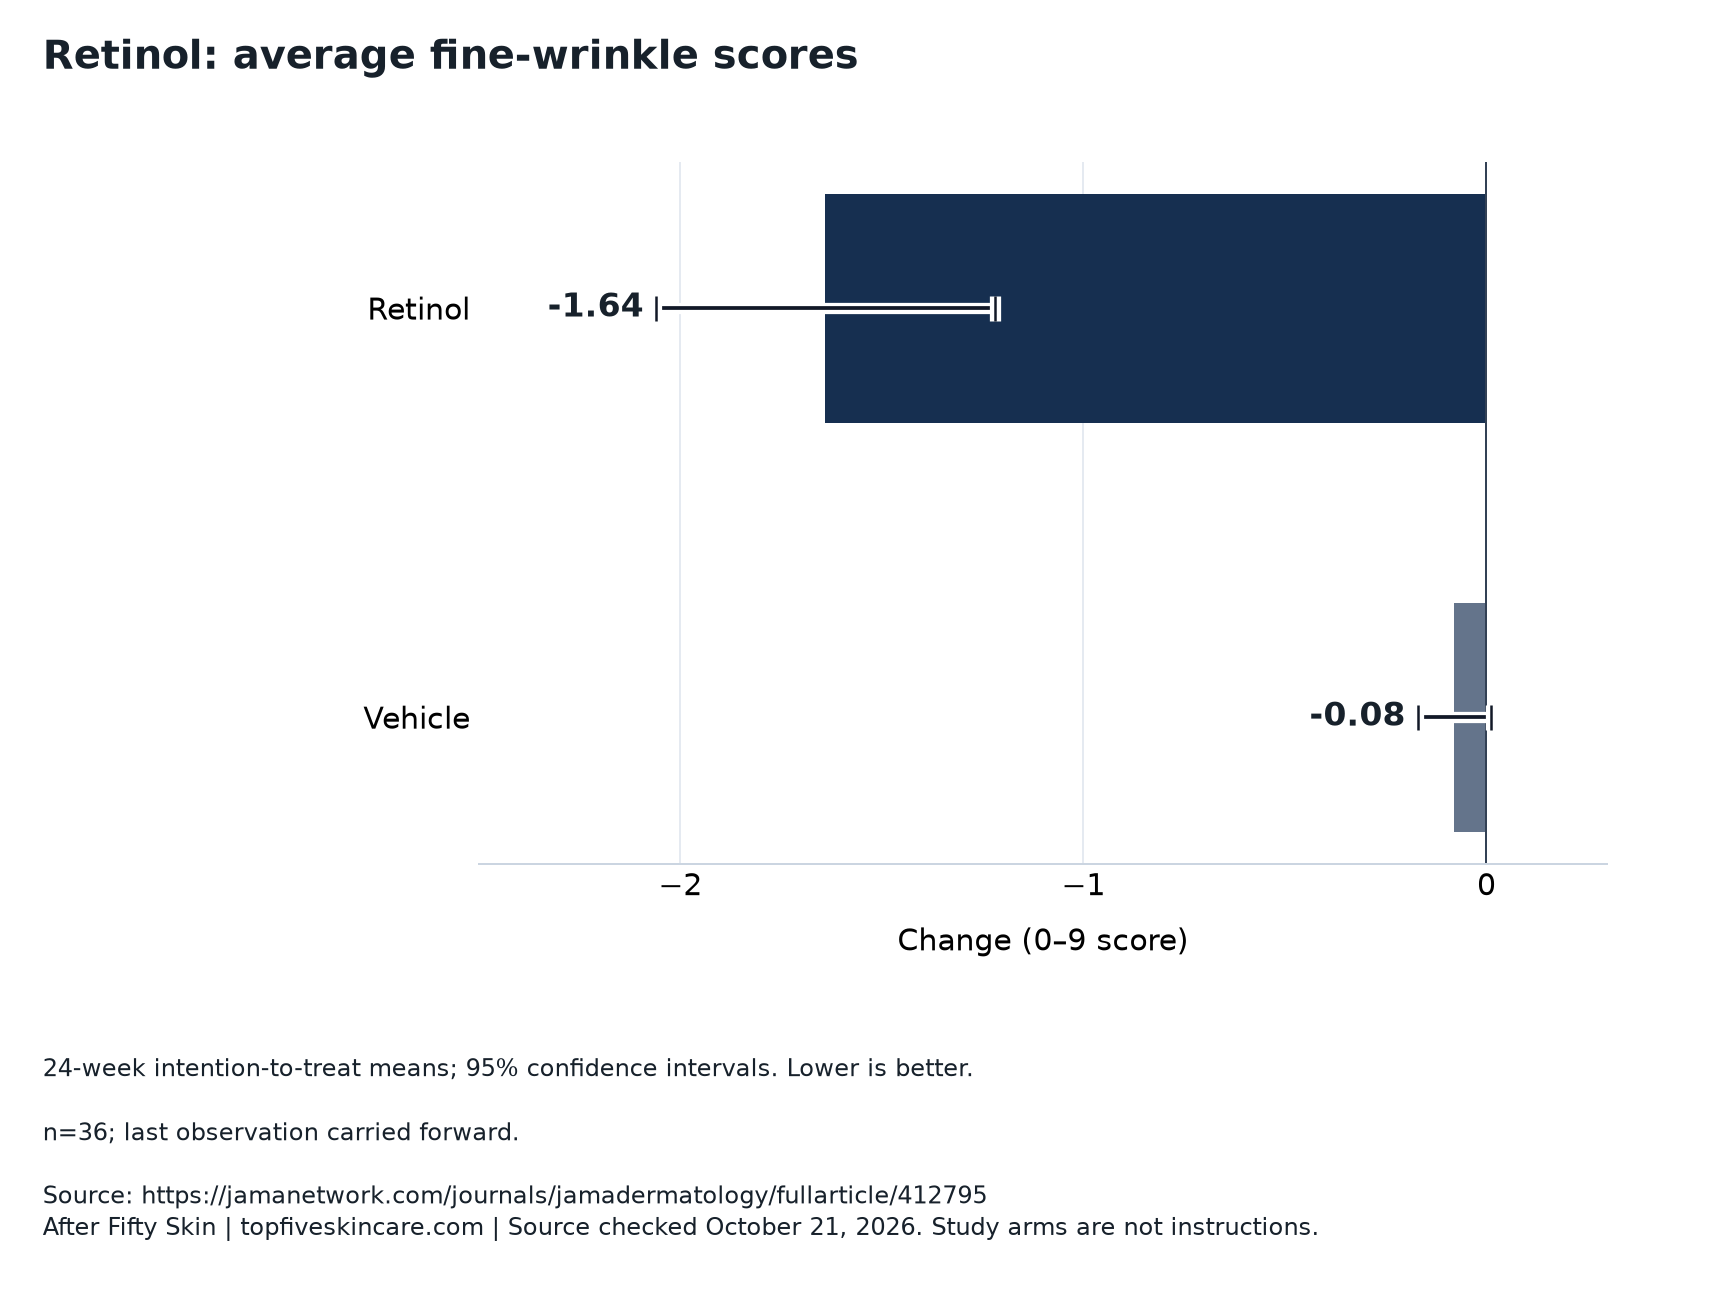
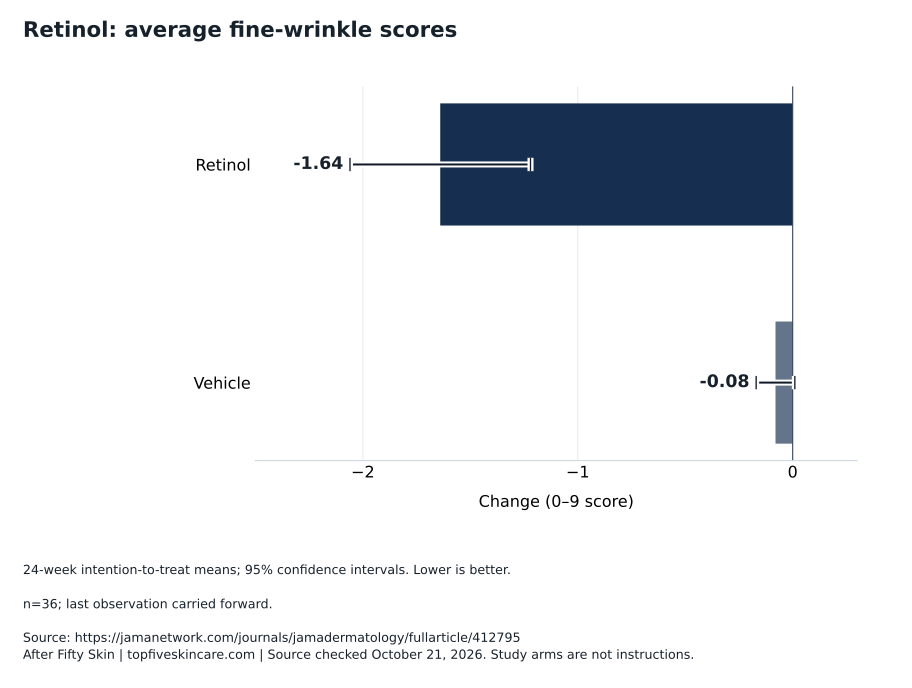
24-week intention-to-treat means; 95% confidence intervals. Lower is better.
n=36; last observation carried forward.
Download chart (PNG)Download data (CSV)Download vector chart (SVG)
| Study arm | Reported value | 95% confidence interval |
|---|---|---|
| Retinol | -1.64 | -2.06 to -1.22 |
| Vehicle | -0.08 | -0.17 to 0.01 |
Count participants before counting skin sites
The full Kafi report describes randomized paired upper-inner-arm treatment in 36 participants averaging 87 years, using laboratory 0.4% retinol and vehicle for 24 weeks. Twenty-three completed; 13 withdrew, including three for irritation. Planned applications were up to three weekly; the delivered mean was 1.6.
The design’s essential feature is the relationship between observations. Each participant contributes a comparison between assigned sites. Counting the sites as though they were unrelated people would discard the matching that the experiment was built around. Counting repeated visits as additional people would make a further mistake: a measurement occasion adds information about a participant, not another independent participant with a separate history.
A clear report therefore distinguishes people, sites and visits. These counts answer different questions about recruitment, assignment and observation. More measurements can improve understanding without increasing the number of independent people in the same proportion. Before interpreting precision, ask what unit the analysis treats as independent and whether that choice matches how the data were collected. Our guide to evaluating mature-skin evidence provides context for asking this question when a headline presents a single impressive sample count.
Shared circumstances help, but sides still differ
Pairing can address characteristics that both sites share through their participant. A person’s age, for example, does not differ between their left and right arms at the same visit. Comparing those sites avoids the need to match that particular characteristic across two different people. This is the intuitive strength of a within-person design: some background differences are held together rather than left to vary between groups.
The sites are not interchangeable simply because they belong to one person. They may have different starting measurements, histories of local exposure or measurement errors. A randomized assignment of conditions to sides helps prevent systematic side preference in assignment, but it does not guarantee identical observations. Nor does pairing eliminate the need for consistent assessment. These are possible design concerns, not claims that a specific imbalance or measurement failure occurred in this experiment.
Thinking in pairs changes the question from whether one set of sites looks different from another to how the assigned conditions differ within people. The guide to tretinoin strength comparisons considers a different comparison structure. The useful choice between designs depends on the research question and on whether sites can reasonably provide the relevant alternative for each other, rather than on which design sounds more sophisticated.
Subtract within the person first
Here is a fictional teaching dataset, unrelated to the retinol trial. Three invented participants have changes on side A of minus 2, minus 1 and minus 3. Their changes on side B are minus 1, zero and minus 1. These arbitrary score changes have no validated clinical interpretation. Subtracting B from A within each person gives minus 1, minus 1 and minus 2. Their sum is minus 4, so the mean paired difference is minus 4 divided by 3.
The table keeps each participant’s two measurements on the same row. That alignment is part of the information. If the B measurements were reassigned to different people, the side averages would stay the same, but the individual paired differences and their spread could change. An analysis of precision needs the correct pairing, not merely the two lists of observations. This is why individual links matter even when a simple difference of the two means gives the same numerical mean contrast.
The example separates arithmetic from meaning. A negative paired difference identifies a direction on this invented scale. It does not specify whether someone notices a change or considers it worthwhile. Those interpretations need a defined outcome and evidence connecting its numerical changes to the experience being discussed.
| Invented participant | Side A / side B change | Paired difference, A − B |
|---|---|---|
| Person 1 | −2 / −1 | −1 |
| Person 2 | −1 / 0 | −1 |
| Person 3 | −3 / −1 | −2 |
| Mean paired difference | Sum of paired differences: −4 | −4 ÷ 3, approximately −1.33 |
Precision depends on how the measurements move together
Imagine two fictional sets of paired measurements with the same average on each side. In one set, both sides tend to move together within people. In the other, a large change on one side is often paired with a small change on the other. The difference between the side averages could be identical in these two datasets, while the variability of the within-person differences is different. That variability matters when estimating the uncertainty around the paired contrast.
For this reason, confidence intervals around separate side means cannot simply be subtracted to produce the confidence interval for their paired difference. The relationship between the measurements is also needed. An interval summarizes uncertainty for a particular estimate under particular assumptions; it is not a detachable error bar that can be moved to another calculation without considering the design. An interval for a different estimate would require its own justified calculation.
Before interpreting any horizontal score chart, identify the quantity on its axis and the definition of the interval. A score difference is not automatically a percentage of the underlying feature removed. More generally, a confidence interval about an average is also different from a range predicting individual experiences. Reading the axis, the summary label and the interval definition together prevents those separate meanings from collapsing into one visual impression.
Exposure, attendance and assessment are separate records
A schedule describes what was intended to happen. An application record describes what was delivered. An assessment record describes what was measured. These are different records even when they share the same calendar. A participant might attend an assessment after missing an application, or receive an application without having the later endpoint measured. Neither record can automatically be substituted for the other when describing how complete the evidence is.
This distinction becomes especially useful when tolerability affects exposure. An analysis may describe the result of assignment under the study’s actual delivery procedures, rather than the result of receiving every planned application. Estimating a different effect, such as uninterrupted exposure, would require a suitable analysis and assumptions. Selecting only people who received everything can introduce selection problems if the reasons for receiving less also relate to the outcome. It does not automatically reveal a cleaner causal effect.
The study schedule is historical context, not a routine for readers. Our simpler mature-skin routine guide discusses a different, practical reading context. For interpreting a paper, keep a three-column mental record: intended exposure, delivered exposure and observed outcomes. That simple distinction makes claims about adherence and follow-up more precise without making assumptions about why an individual visit or application was missed.
An absent outcome is not a zero
Consider another entirely invented example, unrelated to the trial. Four people are meant to have a change recorded, but only three values are observed: minus 2, minus 1 and zero. Their observed mean is minus 1. The fourth value is missing. If it were minus 3, the four-person mean would be minus 1.5. If it were plus 3, the four-person mean would be zero. Neither assumed value is evidence about the absent person.
The purpose of this arithmetic is to expose dependence on an assumption. A blank cell does not mean no change, and omitting the cell does not establish that the observed people represent the unobserved person. The two alternatives are illustrations, not plausible bounds for a real study. Choosing credible alternatives requires knowledge about the outcome, the timing of loss and the circumstances in which measurements became unavailable.
This is the idea behind sensitivity analysis: ask how the conclusion changes under different defensible assumptions. It is most informative when the assumptions and their rationale are visible. A result that changes under small, plausible departures deserves a different interpretation from one that remains stable across them. Our mature-skin discussion comparison is a separate editorial starting point for identifying which outcomes a reader would actually want an evidence summary to address.
Carrying a value forward does not observe the future
Last observation carried forward means reusing a participant’s most recent recorded value at a later analysis time when the later observation is absent. The earlier value is real; its use as a substitute for the later value is an analytical choice. This choice treats the unobserved interval in a particular way. It does not establish that nothing changed during that interval, because the very problem is that the later measurement was not obtained.
The direction of the resulting distortion is not guaranteed. If the unseen outcome would have improved, carrying forward an earlier value could understate improvement. If it would have worsened, the same rule could overstate improvement. These are hypothetical possibilities, not findings about the missing outcomes in this trial. Calling the rule conservative without specifying the outcome trajectory and comparison assumes the answer to the question the rule is meant to address.
The table distinguishes an observation from an assumption without pretending that missing values can be recovered by better wording. A transparent analysis identifies the rule, explains why it was chosen and explores relevant alternatives where possible. The number of rows included in a final calculation is therefore only part of the story. Readers also need to know which entries were measured at the endpoint and which were supplied by the rule.
| Record or rule | What is known | What is not established |
|---|---|---|
| Measured endpoint | A value was recorded at the relevant assessment | Every other participant had the same experience |
| Missing endpoint | The intended later observation is unavailable | No change occurred |
| Earlier observed value | A measurement exists at an earlier time | It equals the unobserved later value |
| Carry-forward analysis | The earlier value is reused at the later analysis time | The later outcome was newly measured |
| Sensitivity analysis | Alternative assumptions are examined | Any assumed value is an observed fact |
Different displays can summarize different evidence
The Kafi clinical table uses intention-to-treat analysis with last observation carried forward; Figure 2 uses completers and standard errors. Biopsy subsets were small, and only significant findings were reported. Four inventors disclosed conditional patent royalties.
These distinctions make a useful reading exercise. A display restricted to people with final observations and a display including filled-in observations need not summarize the same evidence. Their labels should identify the included population and the method. A graph can look more detailed because it shows several time points while still representing a narrower group. More points on a line do not necessarily mean more participants or less uncertainty about missing outcomes.
A tissue measurement introduces another distinction: a subset can contribute information about a biological question without representing the clinical outcome for everyone. The subset’s selection, size and measurement purpose matter. Selective reporting of statistically significant effects also makes the visible results an incomplete picture of what was examined. Separately, disclosed financial interests belong in the evidence context; they neither prove a result false nor replace scrutiny of design and analysis. Our Likeness Rx review offers a documentary review to consult separately from these research judgments, without attributing this experiment’s outcomes to that service.
A result needs a bridge to a different setting
Transferring a research result means asking whether the effect in one setting informs a target setting. That bridge involves the population, body site, preparation, delivery procedures and outcome. Similarity on one feature does not establish similarity on all of them. Being an older adult is a broad description, not a guarantee that a result from one age distribution estimates the result for every reader in their fifties or beyond.
Other evidence has its own boundaries. The 1995 concentration abstract reports 99 completers, with unknown initial enrollment and allocation method; tissue percentages are not wrinkle reduction. The 2005 abstract describes a two-year 0.05% tretinoin emollient-cream comparison involving 204 treated participants. OrthoNeutrogena support and author financial relationships are documented in the acknowledgment; full methods and results were not reviewed. Those records cannot reconstruct missing paired observations from a different experiment.
As editorial interpretation, a product review is useful for checking what documentation actually describes. The Dermatica Retinal review can be read for that purpose without treating similarity in ingredient terminology as clinical equivalence. The missing bridge may require a direct comparison, a relevant finished-formulation study or a clearer account of the target outcome. Identifying which bridge is absent is more useful than assuming that every related paper answers the same question.
Ask for the record that would resolve the question
The RENOVA label addresses a specific 0.02% tretinoin cream used adjunctively for fine facial wrinkles with comprehensive skin care and sun avoidance. Its limits beyond 52 weeks and above age 71 are formulation-specific. Official labeling is a distinct evidence role; its response categories cannot be substituted for another study’s rating scale.
A useful research question points toward a record that could answer it. Uncertainty about pairing calls for linked participant-level observations. Uncertainty about follow-up calls for observation times and reasons for loss. Uncertainty about an imputation rule calls for its assumptions and suitable sensitivity analyses. Uncertainty about practical meaning calls for evidence connecting a measured change to something people notice or value. A sample-size planning assumption alone does not establish that connection.
Readers need not perform a new analysis to recognize these requirements. They can ask whether the report preserves the links between people, measurements and assumptions. Our guide to moisture and a comfortable baseline offers a separate route into everyday care questions. Here, the scientific task ends with a clear account of what the experiment observed and what its analysis assumed. A summary that exposes that boundary is more informative than an apparently definitive number with its observation history removed.
Questions about the evidence
Do two arms double the participant count?
No. Two sites can provide a useful within-person comparison, but they share a participant and must be interpreted accordingly. The number of people, sites and visits should each be reported for the purpose they serve. More observations do not automatically create the same number of independent participants.
Why can the difference between means be easy while its interval is not?
The average contrast can be calculated from the side averages when the same paired observations contribute. Its precision also depends on how the measurements vary together within people. Separate mean intervals do not contain that complete relationship, so subtracting their endpoints does not recover the paired contrast interval.
Does including everyone in a table mean every final outcome was measured?
No. An analysis can retain a participant by using a stated rule for missing values. The report should distinguish newly observed endpoints from values supplied by that rule. An intention-to-treat label alone does not explain how missing measurements were handled or remove the assumptions that handling requires.
Is a completer analysis automatically more trustworthy?
It uses observed outcomes among people who remained, but the selection of those people may matter. An analysis including substituted outcomes has different assumptions. The useful comparison examines what each analysis estimates, who contributes and how conclusions depend on missingness, rather than declaring either label universally superior.
Can a biological finding settle whether a change is worthwhile?
It can contribute to an explanation, but practical importance requires an appropriate link to the outcome people value. A tissue measurement, an assessor’s score and a participant’s experience are different forms of evidence. One cannot simply replace another because it produces an appealing numerical result.
Editorial assessment
A paired experiment is strongest as a reading exercise when its connections remain visible: both sites belong to a person, repeated measurements belong to a timeline, and missing entries require an explicit analytical decision. The central question is therefore how the reported estimate was assembled. Which observations were linked, which were available at the endpoint and which assumptions supplied what was absent? Keeping those questions visible allows a reader to appreciate the study’s information without turning a group summary into an individual forecast. It also identifies the exact additional evidence needed before applying the result to another formulation, body site or care setting.
Research access and limitations
This guide examines an accessed full retinol report without individual data or supplements. Numerical teaching examples are invented, not trial reanalyses or missing-outcome bounds. Historical treatment details are not use instructions. Clinical scores, tissue findings and product-label categories remain separate outcomes; no retail equivalence or individual result is established.